The new world map, explained
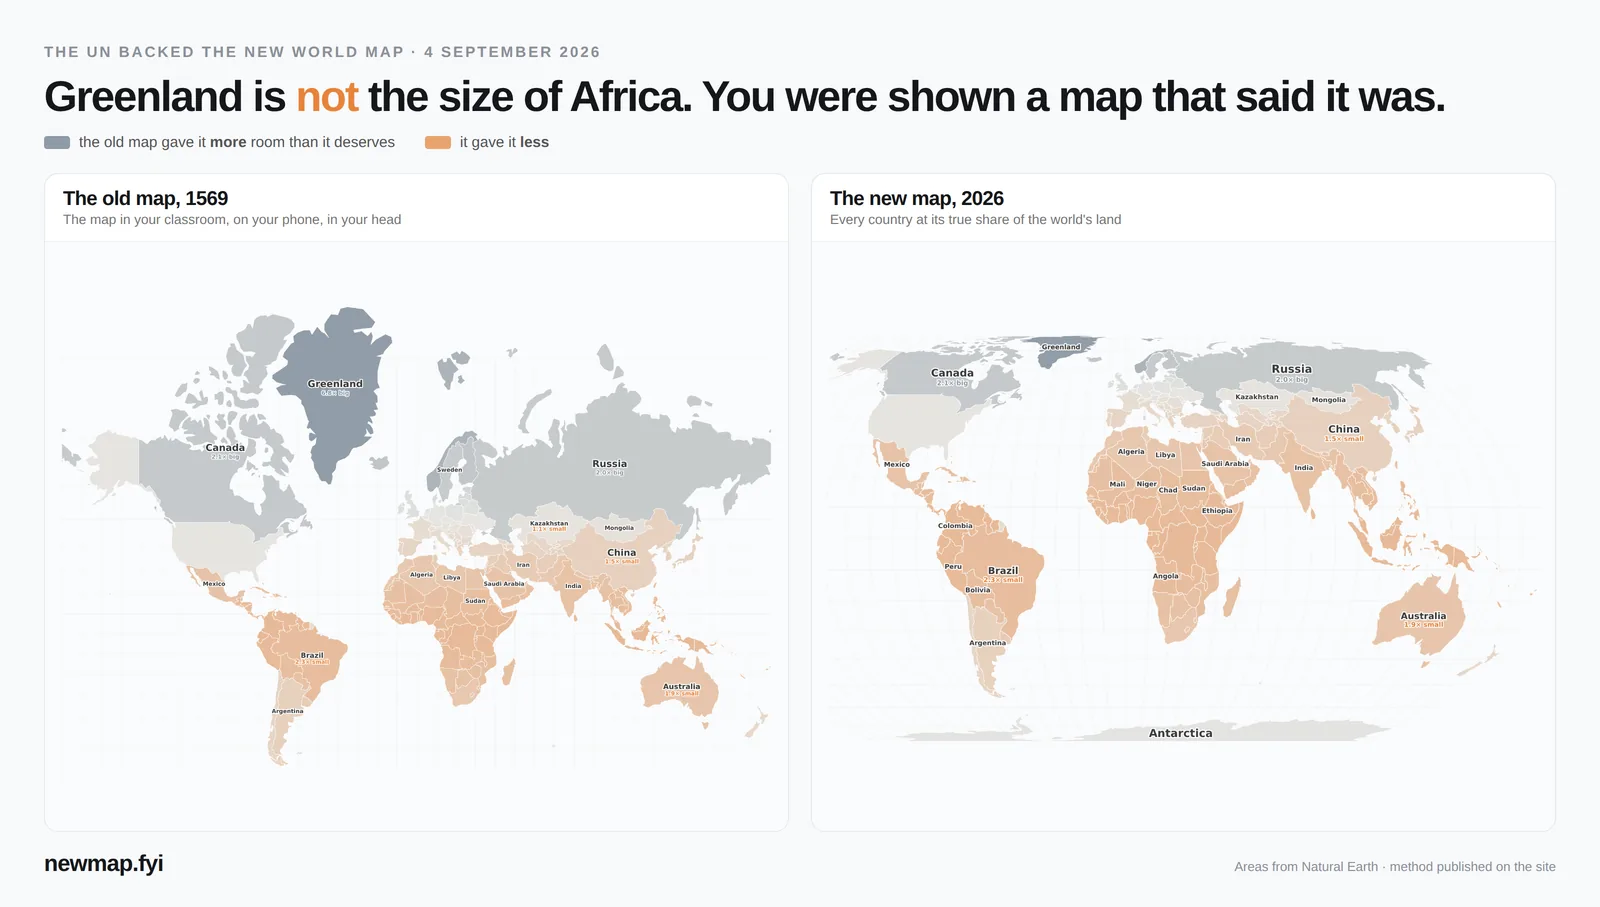
On 4 September 2026 the United Nations backed a new world map — one that shows every country at its true size. Here is what the vote actually did, what the new map is, and why the old one looked so different.
What happened on 4 September 2026
The UN General Assembly adopted a resolution nicknamed “Correct the Map”. Togo led it on behalf of the African group of countries, building on a campaign backed by the African Union, and France co-sponsored it. It passed by 164 votes to 1, with 6 abstentions. The United States was the only country to vote against; Estonia, Georgia, Lithuania, Moldova, Serbia and Ukraine abstained.
The resolution encourages governments, schools, international organisations and technology companies to use the Equal Earth map, or another equal-area map, whenever the point of a map is to compare the size of places — and to teach that every flat map of a round planet has limits. It is not legally binding: no country is required to change anything.
What is the new world map?
The map the resolution points to is called Equal Earth. Three cartographers — Bojan Šavrič, Tom Patterson and Bernhard Jenny — published it in 2018. It is an equal-area map: every country takes up the same share of the map as it does of the real world. If one country is twice the size of another, it is drawn twice as big.
Equal-area maps are not new, but earlier ones tended to look strange — continents stretched tall and thin. Equal Earth keeps sizes correct while still looking like the world you know, with gently curved sides. That is why it was chosen.
What was wrong with the old map?
The world map on most classroom walls was drawn in 1569, for sailors. On it, a straight line is a constant compass direction, which made it brilliant for steering a ship. The price is size: to keep directions straight, the map stretches everything the further it gets from the equator.
So places near the poles look huge and places near the equator look small. Greenland looks about as big as Africa on the old map; Africa is really about 14 times bigger. North America is 18.0% of the world's land but takes 34.3% of the old map. Africa is 22.3% of the land and gets only 10.3%.
The old map was never a lie — it is still the right map for navigation. The problem is that a map made for steering ships became the default picture of the world for over 450 years, for a job it was never made for. See the old map and the new map compared, country by country →
What the vote does not change
- No border moved and no country got bigger. Only the way size is shown changes.
- Ships and planes keep the old map for navigation, which is what it was built for. The resolution says so.
- Phone maps are unlikely to change soon. Google Maps, Apple Maps and most online maps are built on a web version of the old map, because it tiles neatly as you zoom in. The resolution matters most for classrooms, textbooks and news graphics.
Who is switching
The African Union had already adopted Equal Earth before the vote. Togo plans to update its school geography materials, and France has said it will stop using the old map in official communications in favour of maps that are faithful to real area.
See your own country
Most people don't care about Greenland — they want to know what the old map did to their own country. Every country has its own page: India, Brazil, Nigeria, Indonesia, Democratic Republic of the Congo, Mexico, Australia, China, or all 176 countries, ranked.
Sources
- UN meetings coverage: General Assembly adopts text to ‘Correct the Map’
- UN Office of the Special Adviser on Africa: Victory for Africa as UN votes to “Correct the Map”
- Al Jazeera: UN votes to adopt new world map that reflects Africa’s true size
- Visual Capitalist: The new world map the UN wants you to use
- equal-earth.com: the Equal Earth projection (Šavrič, Patterson & Jenny, 2018)
- Areas and map shares on this page: computed from Natural Earth boundaries — method on the map page.
The map · The new world map, explained · Old map vs new map · Every country, ranked · Which country is bigger? (daily game) · Guess the shape · Free printable map · Embed the map on your site · About