Old map vs new map
The world map most of us learned was drawn in 1569 for sailors. The new world map, backed by the UN in September 2026, shows every country at its true size. Put side by side, the difference is bigger than most people expect.
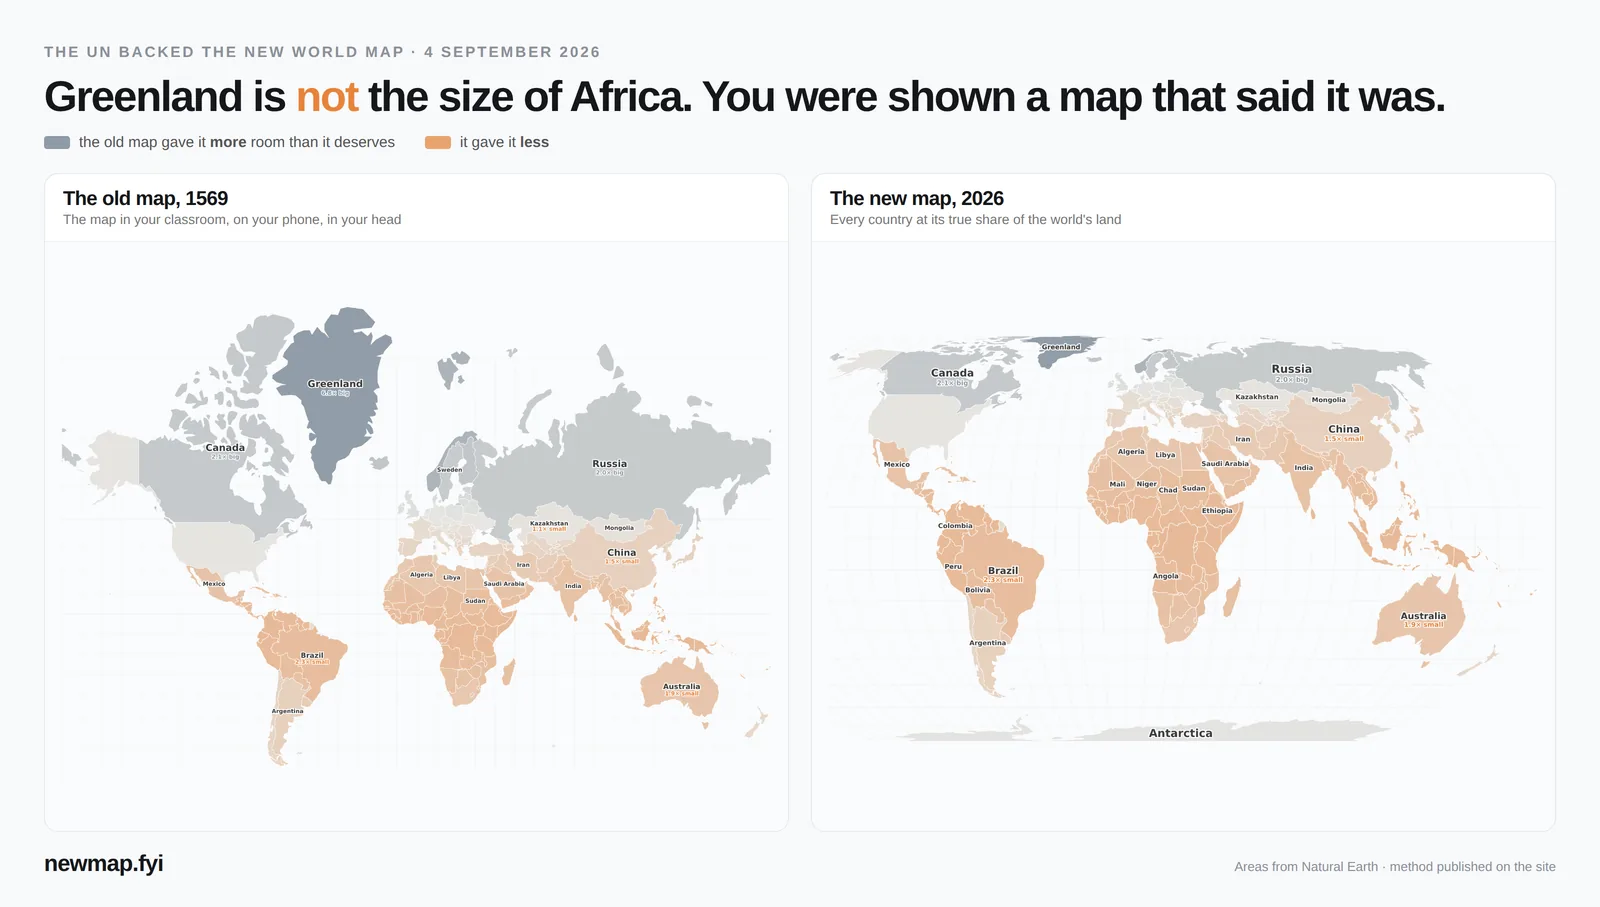
The difference, continent by continent
Each continent's share of the world's land, against the share of the old map it takes up. North America gets almost twice the room it deserves; Africa gets less than half.
| Continent | Share of land | Share of old map | Old map shows it |
|---|---|---|---|
| North America | 18.0% | 34.3% | 1.9× too big |
| Europe | 5.0% | 6.1% | 1.2× too big |
| Asia | 22.6% | 14.1% | 1.6× too small |
| Oceania | 6.3% | 3.3% | 1.9× too small |
| South America | 13.1% | 6.3% | 2.1× too small |
| Africa | 22.3% | 10.3% | 2.2× too small |
Countries the old map made too big
The further a country is from the equator, the more the old map stretches it. These twelve gain the most.
| Country | Old map shows it |
|---|---|
| Greenland | 6.8× too big |
| Norway | 3.7× too big |
| Iceland | 2.3× too big |
| Finland | 2.3× too big |
| Canada | 2.1× too big |
| Russia | 2.0× too big |
| Sweden | 2.0× too big |
| Estonia | 1.5× too big |
| Latvia | 1.4× too big |
| Denmark | 1.3× too big |
| Lithuania | 1.3× too big |
| The United Kingdom | 1.2× too big |
Countries the old map made too small
Countries on or near the equator lose the most — mostly in Africa, South America and Southeast Asia.
| Country | Old map shows it |
|---|---|
| Ecuador | 2.4× too small |
| Equatorial Guinea | 2.4× too small |
| Gabon | 2.4× too small |
| Uganda | 2.4× too small |
| Burundi | 2.4× too small |
| Congo | 2.4× too small |
| Kenya | 2.4× too small |
| Rwanda | 2.4× too small |
| Indonesia | 2.4× too small |
| Malaysia | 2.4× too small |
| Suriname | 2.4× too small |
| Brunei | 2.4× too small |
These are two ends of one list. See all 176 countries, ranked →
Things that look the same size but aren't
- On the old map, Greenland and Africa look about the same size. In reality Africa is 13.9× bigger than Greenland.
- On the old map, Russia looks 2.5× bigger than Africa. In reality Africa is 1.8× bigger than Russia.
- On the old map, Europe and South America look about the same size. In reality South America is 2.6× bigger than Europe.
- On the old map, Canada looks 1.5× bigger than Africa. In reality Africa is 3.0× bigger than Canada.
- The United States, China, India and Europe all fit inside Africa at once — with room to spare.
Why the old map does this
You can't flatten a ball without stretching something. The old map was built so a straight line is a constant compass direction — perfect for a ship's navigator. To keep that true, it stretches land more and more the further it is from the equator, until the poles can't be drawn at all. That is why Antarctica looks like an endless strip, and why Greenland looks the size of Africa.
The new map makes the opposite choice: it keeps every country's size correct, and lets shapes bend a little instead. For comparing places — which is what most of us use a world map for — that is the honest choice. Read what the UN vote changed →
Measure your own country
Every country has its own page with its true size, how the old map drew it, and what it fits inside — for example India, Brazil, Nigeria, Indonesia, Mexico, Australia.
How the numbers are worked out: true area is each country's area on the globe, from Natural Earth boundaries. “Old map shows it” is the country's share of the old map divided by its real share of the world's land. Boundaries follow de-facto control, so disputed areas may differ from official figures. Continents follow the UN groupings; Russia is left out of both Europe and Asia.
The map · The new world map, explained · Old map vs new map · Every country, ranked · Which country is bigger? (daily game) · Guess the shape · Free printable map · Embed the map on your site · About